

N28.58 trillion was remitted to Nigeria’s Federation Zccount between 2012 and 2016, according to a report from the Nigeria Extractive Industries Transparency Initiative (NEITI).


The remittances, according to the agency’s latest Fiscal Allocation and Statutory Disbursement (FASD) Audit report for the period 2012-2016, came from three major sources: mineral revenues, non-mineral revenues and value added tax (VAT).
Apart from remittances to the Federation Account, the audit tracked statutory allocations and their applications with specific focus on nine states, four interventionist agencies, and five special funds. The essence is to examine funds receipt and their utilisation. This latest allocation and disbursement audit is the second by NEITI, the first cycle covered year 2007 – 2011.
The nine states covered by the statutory allocation and disbursement segment of the report are: Rivers, Bayelsa, Akwa Ibom, Nasarawa, Delta, Ondo, Imo, Kano and Gombe states. The Federal agencies are: Niger Delta Development Commission (NDDC), Petroleum Technology Development Fund (PTDF), Tertiary Education Trust Fund (TETFUND); and Petroleum Products Pricing Regulatory Agency (PPPRA). The special funds are: Natural Resources Development Fund (NRDF), Petroleum Equalisation Fund (PEF), Excess Crude Account (ECA), Ecological Fund (EF), and Stabilization Fund (SF).
A breakdown of the N28.58 trillion remitted to the Federation Account shows that minerals contributed highest sum of N18.15 trillion (after deductions for joint venture cash calls and subsidy claims), representing 64% of the total earnings, followed by non-mineral source N6.68 trillion, representing 23%, while value-added tax (VAT) was put at N3.73 trillion, representing 13%.
A year-by-year breakdown of the total remittances showed that N4.19 trillion was remitted in 2012, while N4.73 trillion was recorded in 2013. Furthermore, N4.69 trillion was recorded in 2014 while N2.89 trillion and N1.65 trillion were remitted in 2015 and 2016, respectively.
Analysis of the N18.16 trillion mineral revenues shared among the three tiers of government showed that Federal Government received N8.32 trillion from 2012 – 2016, the 36 State Governments shared N4.22 trillion while the 774 LGs got N3.25 trillion. This is exclusive of N2.36 trillion 13% derivation to the oil, gas and mining producing states.
The report also disclosed that from the share of non-mineral revenues of N6.68 trillion, the Federal Government received N3.52 trillion, while the 36 states got N1.79 trillion and 774 local governments took N1.38 trillion. The total VAT revenue of N3.73 trillion was shared as follows: FGN – N560 billion, 36 States – N1.88 trillion and 774 LGAs – N1.31 trillion.
NEITI report disclosed that out of the N18.15 trillion recorded from mineral revenue within the period, highest receipt of N4.73trillion representing about 26.07% was recorded in 2013. It, however, noted that the plunge in global oil revenue from 2015 negatively affected mineral revenue remittances within the period.
“There was a decrease in global oil revenue from 2015 which accounted for the decrease in mineral revenue from N4.69 trillion in 2014 to N2.89 trillion in 2015 and to N1.65 trillion in 2016,” the report stated.
The report also revealed that out of total mineral revenue, the Nigerian National Petroleum Corporation (NNPC) remitted N8.62 trillion, the Department of Petroleum Resources (DPR) remitted N3.80 trillion, while the Federal Inland Revenue Service (FIRS) remitted N10.46 trillion, noting that the NNPC remittances were highest in 2012, with its JV cash calls highest in 2014.
“NNPC’s net remittances to the federation account reduced from N2.38 trillion in 2012 to N789 billion in 2016. Out of the N18.16 trillion mineral revenues remitted in the period 2012-2016, the year 2013 accounted for the highest receipt of N4.73 trillion. There was a decrease in global oil revenues from 2015, which accounted for the decrease in mineral revenues from N4.68 trillion in 2014 to N2.89 trillion in 2015 and N1.65 trillion in 2016,” the report stated.
On revenues allocation and utilisation by the states, the report disclosed that Akwa Ibom received the highest total mineral revenue of N873.59 billion among the nine states covered by the exercise. This was closely followed by Delta state that received N713.15 billion, while Nasarawa State received the lowest mineral revenue of N145.88 billion, closely followed by Gombe State with N155.22 billion. Imo and Ondo states received N190.42 billion and N247.87 billion, respectively.
Another important disclosure by the report was the trend of lingering heavy dependence on mineral resources among the states for their revenue inflows within the period under review.
“The states reliance on mineral revenue showed that between 40% and 73% of the States revenue is from mineral resources,” the report stated.
Among the nine states covered by the exercise, Rivers and Bayelsa states were the most heavily dependent on mineral resources.
“Rivers State had an aggregate mineral revenue percentage of about 73% of its total revenue for the five years reviewed. Rivers State was followed by Bayelsa State with the second highest mineral revenue of 59%. With 32%, Imo State became least overall dependent on Mineral revenues,” the report noted.
Analysis of expenditure patterns among the nine states showed that from 2012 to 2016, Akwa-Ibom State committed the largest amount of N 947.79 billion into capital expenditure. This was followed by Delta State, which allocated N493.77 billion to capital expenditure. Nasarawa State had the least with capital expenditure of N65.11 billion followed by Ondo State with N138.67 on capital expenditure.
Kano State recorded N316.08 billion as capital expenditure within the period under review, while Bayelsa spent N335.83 billion on capital expenditure. Imo and Gombe states spent N191.34 billion and N148.338 billion on capital expenditures, respectively, within the period under review. NEITI could not establish Rivers State’s capital expenditure because the State refused to cooperate with the audit review process.
Analysis of the states’ capital expenditures in relation to their total revenue revealed Akwa Ibom and Kano as states with relatively good records of capital expenditures. For instance, Akwa Ibom State spent 79% of its revenues on capital in 2012, 62% in 2013, 60% in 2014, 54% in 2015 and 48% in 2016, while Kano State spent 34% of its revenues on capital projects in 2012, 51% in 2013, 49% in 2014 and 61% in 2016. The capital expenditure profile of the states substantially complements their recurrent expenditure pattern.
School Of Alternative Dispute Resolution Launches Affiliate Program To Expand Reach
For more information about the Certificate in ADR Skills Training and the affiliate marketing program, visit www.schoolofadr.com, email info@schoolofadr.com, or call +2348053834850 or +2348034343955. _________________________________________________________________
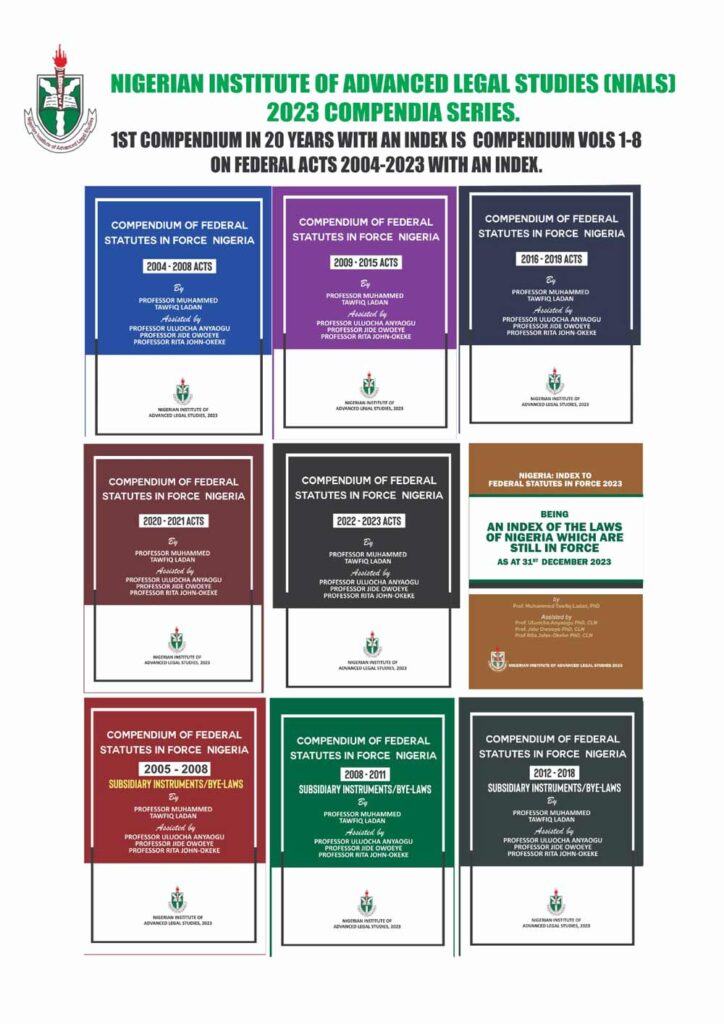
NIALS' Compendia Series: Your One-Stop Solution For Navigating Nigerian Laws (2004-2023)
 Email: info@nials.edu.ng, tugomak@yahoo.co.uk, Contact: For Inquiry and information, kindly contact, NIALS Director of Marketing: +2348074128732, +2348100363602.


